Equity Creation and Destruction
02/28/07
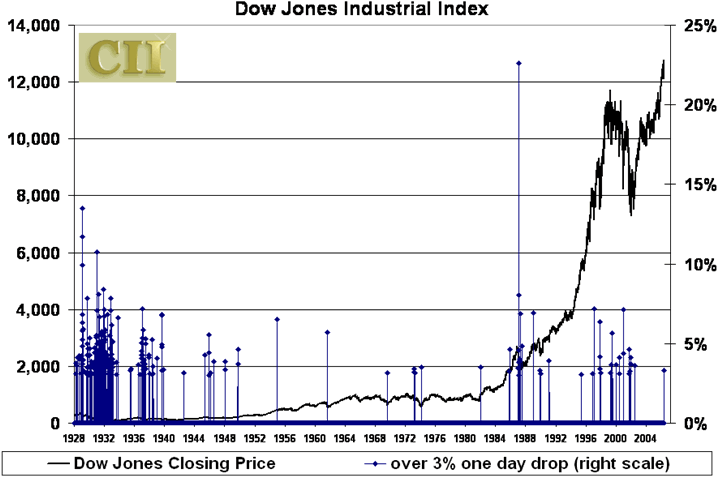
I should have seen it coming, because Merrill Lynch saw it, too. The little article in the Telegraphwas instructive, even prescient as it turns out, but came without instructions to get out within the next two weeks. Too bad. Merrill Lynch and/or the british Newspaper could have created lasting fame like Elaine Gazarelli in 1987, who told her customers to get out two months before the crash of 1987. A six sigma event is characterized by a price drop of six times the volatility (or standard deviations) of the asset , thus the name six-sigma, sigma being the Greek letter representing volatility. Last week was quite a ride, but was it a six-sigma event? Not yet. Drops of 3% or more in one day have occurred frequently over the past 79 years.
There have been 38 days since 1979 when the S&P; 500 has suffered a single-session loss of 3% or more. The average gain in the ensuing 60 days has been 6.9%, with the index rising in 31 of the 38 cases, according to Citigroup research. James Altucher on TheStreet.com looked at the statistics of the Dow Jones Industrial and found that buying at the close of a 3% selloff and holding for 6 months has resulted in 12 out of 15 successful trades for an average return of 11.75% per trade, substantially higher than the average 6 month return during that time. For a 4% selloff its been 6 successes out of 7 occurrences for an average return of 15.23%. The only failure being 9/3/02. All that data torturing only to find out what we already know, which is that statistics favor the bulls because stocks go up in the long run. I do not want to bore you with more platitudes. Let the charts tell us what is going to happen:
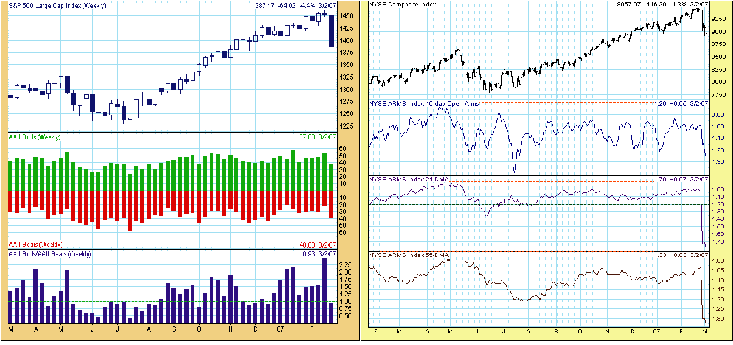
The American Association of Individual Investors (AAII) surveys its membership every week (Wednesday cutoff) and publishes the results on Thursdays. The most recent result above shows a jump in bearishness, as could be expected. The number of bears doubled from 20% to 40%. This is most often used as a contrarian indicator and is turning bullish. The chart to the right shows how vicious the sudden sell-off was. The Arms Index, also known as TRIN, was developed in 1967 by Richard Arms. It is a volume-based indicator, which determines market strength and breadth by analyzing the relationship between advancing and declining issues and their respective volume; it can be applied over short or longer time periods. The S&P; 500 showed on Tuesday 498 decling and 2 above are indicating that sentiment indicators are approaching extremes which should lead to a rallye in the near future, probably this coming week. Of further interest is the fact that the sell-off affected equities and commodities, domestic and international bourses, developed and emerging markets alike. No sector and no country was safe. This is significant. It tells us that
1. The world markets are only separated by distance but are linked by the same portfolios whose portfolio managers see the world through the same models and matrices. Diverse countries like India, China, Brazil and South Africa all dropped on the same day by roughly the same percentages. Diversifikation by region is out. You can no longer spread your risk in emerging markets by investing in different countries. Any country that is categorized as "emerging" will be sold when the perceived "Risk aversion" sets in. Portfolio models and correlation matrices dictate it.
2. No sector was spared - equities of all sectors were sold as if their industry would become obsolete. Health care, Real Estate, Financial Services, Biotechnologie, Basic Materials, they all lost more or less the same percentages during last week’s liquidation. Diversifikation by investing in different sectors obviously did not work either. The asset class "equity" was on sale.
3. Large and Small Caps lost significantly. The S&P; 500 (large cap) lost roughly 4.5% and the Russell 2000 (small cap) lost 6%. Little or no protection through diversification across size or capitalization either.
4. Bombay, Jakarta, Kuala Lumpur, Seoul, Taiwan all started to sell off on Wednesday, not on Tuesday! This is strange because the global sell-off supposedly was kicked off by the Chinese 9% downdraft on Tuesday. Why would all these supposedly globally linked markets wait until the next day before reacting to the sell-off in Shanghai? We can find the explanation in two phenomena, briefly adressed below:
U.S. Business Cycles drive Global Equities Asset Allocation Investment Strategy
The Business Cycle Investor sums it up in the following article: "The impact of the USA business cycles on the U.S. stock market is well understood but its synchronization with world economies and international stock markets is less appreciated by the investment community." The authors most important conclusion (in my mind at least) is that "During a downturn in the U.S. equities, reallocating funds to international equities would not provide an adequate protection; in fact it would be likely to magnify the losses." Their finding basically is that all emerging markets are dependent on - and react to - the US business cycle.
Market Liquidity and Funding Liquidity
The most significant results of this excellent study, sponsored by the NBER are that especially sharp liquidity reductions occur simultaneously across several assets. Their analysis also suggests that central banks can help mitigate market liquidity problems by increasing funding liquidity.
Now it becomes clear that markets in Bombay, Jakarta, Kuala Lumpur, Seoul and Taiwan had to wait for the reaction of the worlds primary financial centers (London and New York). They needed to find out whether
a) liquidity was diminishing and b) the US business cycle might be turning down. Once Greenspan uttered the word "Recession" and then the durable goods orders came in again below expectations market participants in those emerging market centers decided that it was indeed time to sell. After all, "when the U.S. economy sneezes the rest of the world catches cold". In other words, the emerging markets waited one day to determine whether the Chinese sell-off was merely a liquidity shock to the global financial system or whether they were looking at a fundemental shock from the US economy. When it seemed possible that they were looking at both, they did not wait for confirmation and the selling started.
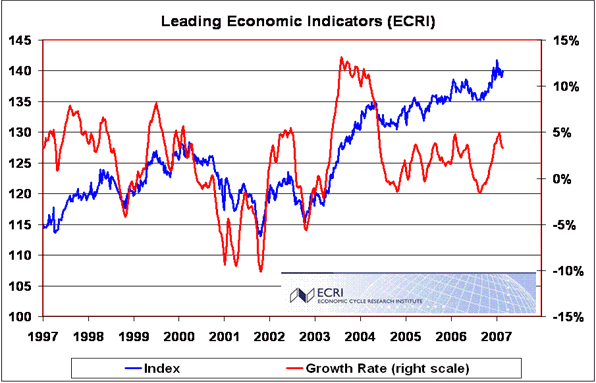
It now becomes necessary for us to determine if we are indeed looking at a possible slowdown in the US that becomes worse than the "mid-cycle" correction currently underway. One tool available is the Weekly Leading Index of the Economic Cycle Research Institute. They make it their business to determine how close we are to a recession. The WLI has an average lead of 10 months at business cycle peaks and three months at business cycle troughs, according to the institute. Take a look.
In my humble opinion it seems clear that the US economy is far from a recession. Chairman Bernanke said that he expects moderate growth this year. I tend to agree with his assessment. Therefore I must conclude that for the moment we are dealing with a liquidity shock, only. Not to minimize4 the risks that these types of events contain. They can turn into nasty surprises because stocks are no GDP futres as somebody once said. Even though the economy is doing fine, stocks can still go down. The sentiment indicators above however give me hope that the worst is already behind us.
Hermann Vohs